
Home / Articles / The cash cycle
The cash cycleThe Inventory Cash Trap: How Stock Quietly Eats Working Capital
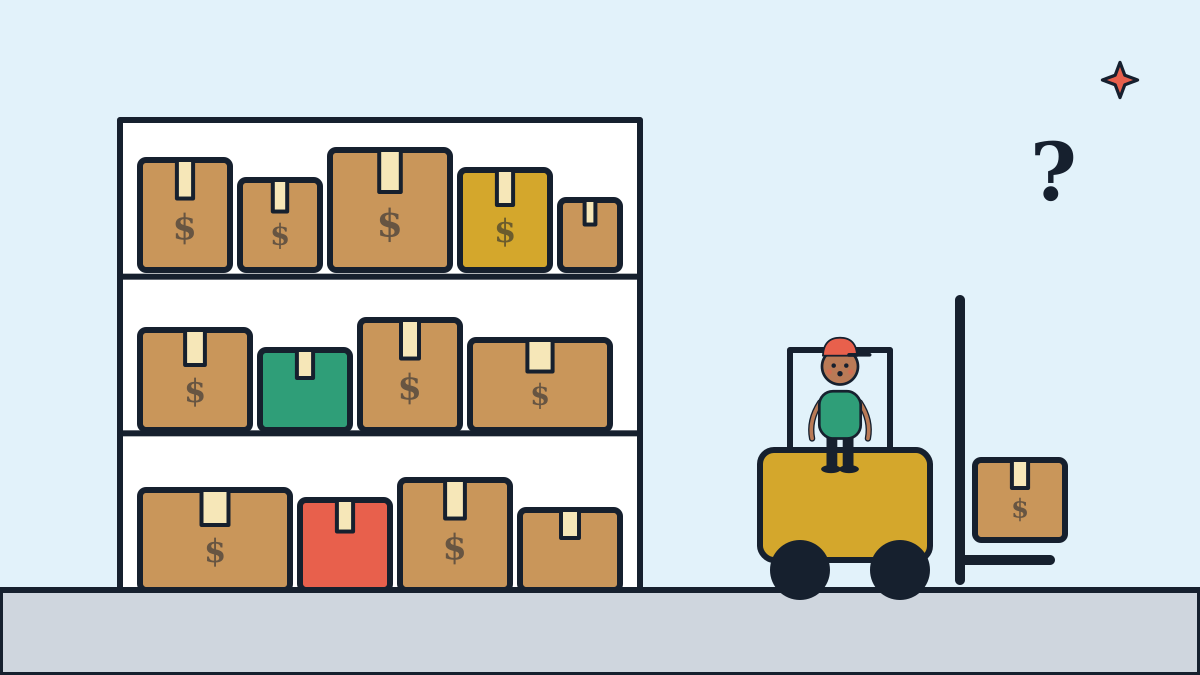
Inventory is the most deceptive current asset. On the balance sheet it looks like wealth. On the shelf, it is cash you paid out weeks or months ago and cannot get back until a customer buys. For product businesses it is often the largest single drain on working capital, and one of the most fixable.
This guide covers how to measure how hard your stock is working, what holding it really costs, and three simple tools for keeping less of it without running out.
Why stock is not as good as cash
When you buy inventory, cash leaves the bank and an asset of the same value appears on the balance sheet, so working capital does not change on paper. But the quality of your working capital has dropped. Cash can pay any bill today. Stock has to be sold first, often after marketing, discounting or waiting for the right season, and some of it never sells at full price.
That is why the quick ratio leaves inventory out entirely, and why lenders that accept inventory as security usually lend only a fraction of its book value.
Measuring it: turnover and days on hand
Inventory turnover = Cost of goods sold ÷ Average inventory
Turnover tells you how many times a year you sell through your average stock level. Divide 365 by turnover and you get days inventory outstanding (DIO), the first component of the cash conversion cycle.
Example: a bike and outdoor shop has annual cost of goods sold of $300,000 and average inventory of $75,000. Turnover is 300,000 ÷ 75,000 = 4, so stock sits for about 365 ÷ 4 ≈ 91 days on average. If the shop could run with $55,000 of average inventory instead, turnover would rise to about 5.5, days on hand would fall to about 67, and $20,000 would be released into the bank.
Calculate turnover by product category as well as overall. A healthy total can hide a fast-selling category propping up a slow one.
What holding stock really costs
The purchase price is only the start. Holding inventory also costs:
- Money: interest on any borrowing that funds it, or the return you give up by not using the cash elsewhere.
- Space: rent, storage units, shelving, heating or cooling.
- Insurance on the stock's value.
- Shrinkage: theft, damage and miscounts.
- Obsolescence: products that go out of fashion, expire, or are replaced by a newer model.
- Handling: staff time spent counting, moving and managing it.
Operations textbooks often quote total carrying costs somewhere around a fifth to a third of inventory value per year, but the real figure varies enormously: fresh food and fashion sit at the high end, hardware and durable parts at the low end. Estimate your own by adding up the items above for a year and dividing by average inventory. Even a rough number is sobering. If the bike shop's carrying cost were 25% a year, the $20,000 of stock it does not need would be costing about $5,000 annually just to keep.
Tool 1: ABC analysis
Not all stock deserves the same attention. ABC analysis ranks items by how much of your sales (or cost of sales) they account for, then manages each group differently.
| Group | Typical share of items | Typical share of value | How to manage |
|---|---|---|---|
| A | Small (often ~10–20%) | Large (often ~70–80%) | Count often, forecast carefully, reorder frequently in smaller batches, never run out. |
| B | Moderate | Moderate | Standard reorder points, review monthly. |
| C | Large (often half or more) | Small | Order in bulk when cheap to do so, or drop slow lines entirely; review quarterly. |
The percentages are loose conventions, not rules. The point is that a handful of products usually drive most of the money, and tightening control on those gives most of the benefit.
Tool 2: reorder points
Reorder point = Average daily sales × Supplier lead time (days) + Safety stock
If the shop sells about 8 inner tubes a day, the supplier takes 12 days to deliver, and the owner wants 20 extra as a buffer, the reorder point is 8 × 12 + 20 = 116. When stock falls to 116, place an order. Setting reorder points from real sales data, rather than ordering "when it looks low", prevents both stock-outs and the slow creep of over-ordering.
Safety stock is the dial: raise it for best sellers with unreliable suppliers, lower it for items that are easy to substitute.
Tool 3: a dead-stock clear-out
- Run a report of items with no sales in the last 90 or 180 days.
- For each, decide: bundle it, discount it, return it to the supplier if allowed, sell it through a clearance channel, or donate it.
- Accept that selling below cost can still be the right call; the cash and the shelf space are worth more than the paper value.
- Ask your accountant how write-downs affect your accounts and taxes.
- Find the buying decision that created the dead stock and change the rule, not just the item.
Frequently asked questions
Is it ever smart to hold extra stock?
Yes: ahead of a known seasonal peak, when a supplier offers a genuinely large discount, or when supply is unreliable and running out would lose customers. The test is whether the benefit beats the carrying cost and the cash strain. The seasonal cash flow guide covers planning a stock build.
What about just-in-time ordering?
Ordering only as needed minimises stock, but it depends on reliable suppliers and short lead times. Many small businesses use a hybrid: lean on A items with dependable suppliers, more buffer where deliveries are unpredictable.
Do I need inventory software?
A spreadsheet can work for a few dozen products. Once you have hundreds of items or several sales channels, most point-of-sale and accounting systems include stock tracking that makes turnover and reorder reports far easier.
Related articles
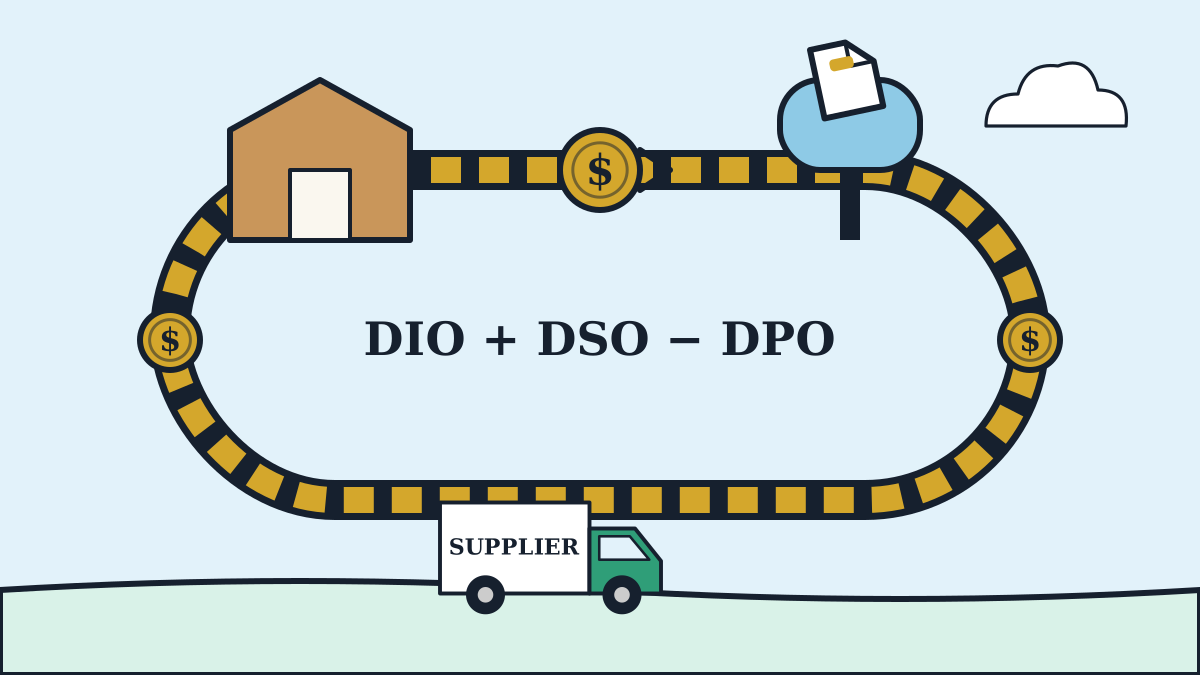
The Cash Conversion Cycle: How Many Days Your Money Is Stuck
DIO + DSO − DPO: a worked example, a mini calculator, and what shaving ten days is worth.
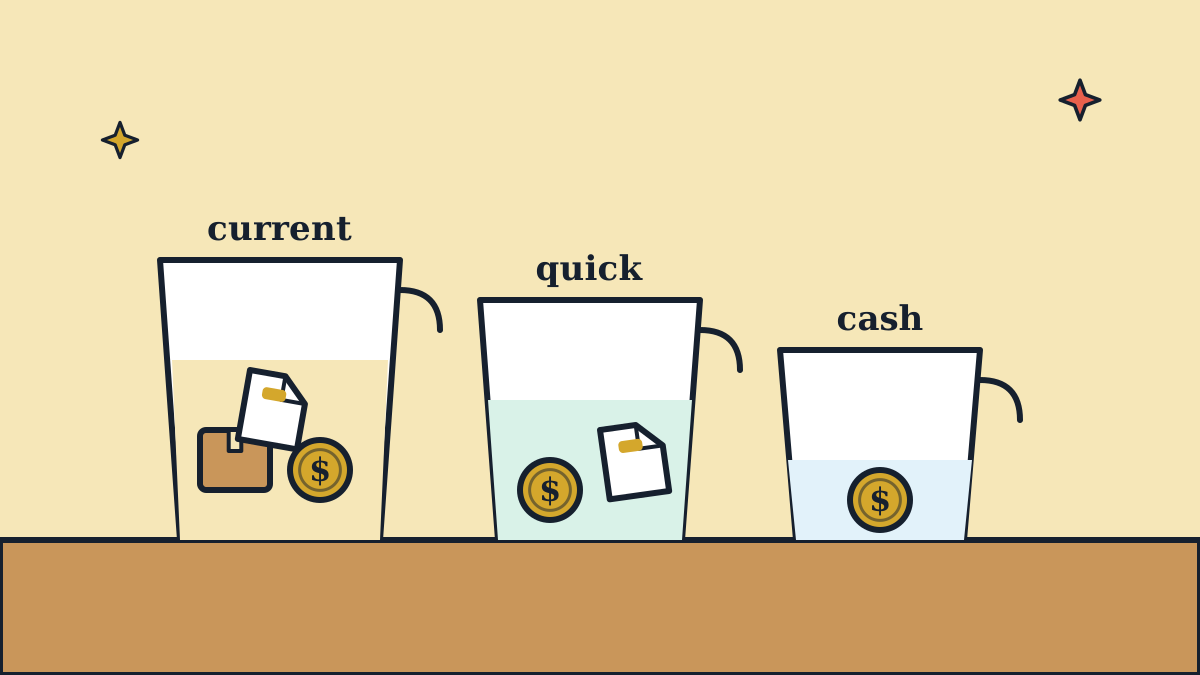
Current Ratio vs Quick Ratio: Which Liquidity Test Matters for a Small Business?
Three liquidity ratios, what each one tests, and why a 2:1 rule of thumb needs context.

Seasonal Cash Flow: How to Survive the Slow Months and Fund the Busy Ones
A month-by-month example that finds the cash trough, plus ways to fund the stock build.